ICU Management & Practice, Volume 18 - Issue 4, 2018
 PRINT OPTIMISED
An evolving partnership
The intensive care unit has benefited greatly from advances in imaging—from diagnosis to planning and monitoring treatment. The radiology-ICU partnership is still evolving, building on recent advances in functional imaging.
Medical specialties by their very nature can work in semi-isolation. While both radiology/imaging and intensive care medicine have become more specialised, they both have more horizontal cross-collaborative practices. Communication is more challenging because of increasing complexity, e.g. determining the significance of T2 weighting on a brain magnetic resonance imaging (MRI) scan, or an unstable patient with invasive haemodynamic monitoring in situ requiring cerebral angiography. The acute nature of work is more accentuated, e.g. uncontrollable gastrointestinal (GI) bleed, the need for a computed tomography (CT) scan of the brain prior to thrombolytic therapy, and deciding where the patient goes to after the procedure.
Challenges for the intensive care doctor include keeping up-to-date with advances in all modes of imaging (CT, angiography, MRI, positron emission tomography [PET], ultrasound). Clear communication with the Imaging department about the need and potential benefit from an imaging procedure is essential, as is knowing when and where to apply a particular imaging technique to an individual patient. The financial perspective should always be recognised by the intensivist requesting an imaging procedure. Point-of-care ultrasound enables many examinations to be done at the bedside. Logistical challenges remain when transporting mechanically ventilated patients to the Imaging department. Translation of findings into everyday clinical practice can also be challenging.
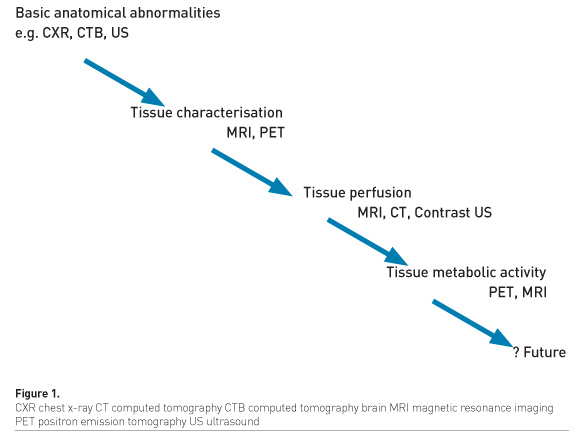
Medical imaging provides structural information, functional imaging and real-time imaging of tissue metabolic activity (Figure 1).
Neuroimaging
Magnetic resonance imaging
MRI has great value in the ICU for prognostication. A recent systematic review and meta-analysis of studies evaluating the predictive value of acute MRI lesion patterns for discriminating clinical outcome in traumatic brain injury confirmed that MRI following traumatic brain injury yields important prognostic information (Haghbayan et al. 2017). Already, functional MRI can compare activation patterns in the brain with task functional MRI (fMRI) mapping with subjects performing a simple ‘hand task’ (Ugurbil 2016).
CT scanning
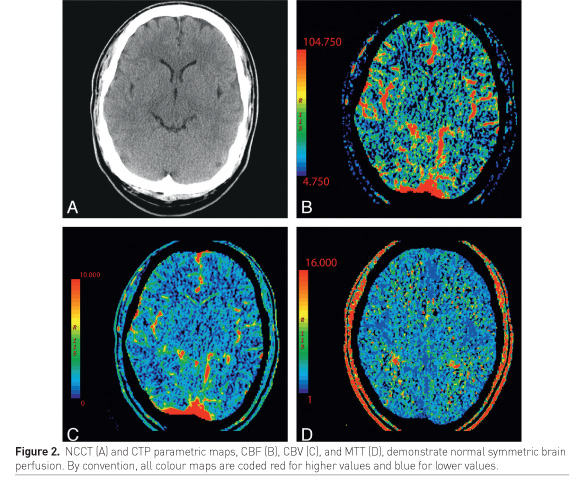
CT brain scanning is usually readily available for the critically ill patient due to organisational preferences in imaging departments. CT scanning has developed to provide advanced structural and functional tissue characterisation. Increasingly used to triage stroke patients, CT perfusion imaging distinguishes normal from abnormal perfusion. It can identify an ischaemic penumbra for example. It is more sensitive for detecting cerebral contusions. Perfusion neuroimaging techniques include CT bolus perfusion, MR imaging bolus perfusion, MR arterial spin labeling perfusion and xenon CT, as recently explained by Douglas et al. (2018).
In acute traumatic brain injury, contrast-enhanced perfusion CT, as illustrated by Lui et al. (2010), can be used to differentiate salvageable tissue from unsalvageable tissue (Figure 2, Figure 3).

Functional brain scanning
The brain represents 2% body weight, and uses 15% cardiac output, 20% total body O2 consumption and 25% total body glucose consumption (Villien et al. 2014). MRI and PET are suitable for structural brain imaging, but not yet suitable for functional brain scanning, as explained below.
The radiotracer 18 F-fluorodeoxyglucose (FDG) has been used to study brain glucose metabolism by PET for the past 40 years. However the “snapshot” takes 20-40 minutes post bolus and it is difficult to obtain temporal resolution compared to fMRI. A recent technique (fPET-FDG) that uses constant infusion FDG appears promising (Villien et al. 2014).
fMRI has good temporal resolution, which is obtained in one pass. Blood oxygen-level dependant (BOLD) is widely employed for brain mapping. However, it is not quantitative in the absolute sense.
Cardiac imaging
Cardiac MRI and myocardial injury
Cardiac MRI can show myocardial tissue structure in detail using the contrast agent gadolinium. Gadolinium differentially accumulates in regional segregated tissue such as a post-infarction scar, thus known as late gadolinium enhancement (LGE) (Puntmann et al. 2016). However, it is not so helpful where diffuse disease is present, as a continuum of disease is present with no reference in the imaging plane. Gadolinium shortens T1 time and the difference between T1 native and T1 gadolinium gives an idea of how much gadolinium is in the extracellular myocardium providing a guide to extracellular volume.
Diffuse myocardial processes can be shown with cardiac MRI, including inflammation, oedema, extravascular volume expansion, infiltrative disease, microvascular ischaemia and fibrosis.
Myocardial oedema
Laine and Allen in 1991 demonstrated in a study of dogs implanted with porous polyethylene capsules that measured end-diastolic interstitial fluid pressure in the left ventricle, that acute myocardial oedema compromises cardiac function and that chronic right heart pressure elevation and chronic arterial hypertension produce left ventricular myocardial oedema (Laine and Allen 1991).
Now pulsing MRI techniques can be used to assess myocardial oedema. On MRI it shows as increased global left ventricular T2 values that decrease with successful decongestion (Verbrugge et al. 2017).
Native T1 (T1 imaging without contrast)
T1 time measures the time taken to recover longitudinal magnetisation. It is moderately water sensitive and elevated in diffuse myocardial fibrosis, inflammation and oedema (Taylor et al. 2016).
Imaging extracellular volume fraction (ECV)
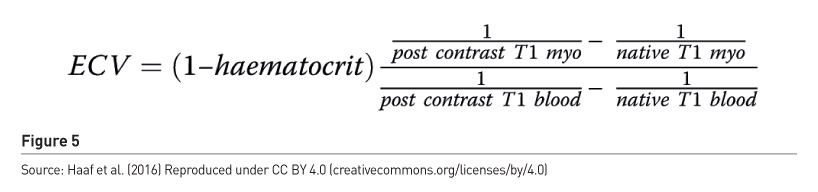
MRI can be used to image myocardial extracellular volume fraction (Figure 4).

The process first obtains T1 in myocardium and blood precontrast, then after administration of gadolinium obtains T1 in the myocardium and blood. ECV is elevated in expansion of extracellular space such as amyloid and myocardial oedema. Imaging can quantify ECV and confirm expansion of extracellular space. The measures are pre- and post-contrast T1 relaxation times of blood and myocardium with correction for blood volume of distribution via the haematocrit (Figure 5).
For ICU patients native T1 MRI imaging can be used to assess inflammation, myocardial oedema and expansion of extracellular volume fraction as well as microvascular dysfunction/microvascular ischaemia.
Myocardial perfusion using PET
Hybrid PET/CT scanners can provide anatomical and functional information, as shown in Figure 6. This shows a 46-year-old male with typical anginal chest pain. The PET scan shows an inferolateral perfusion defect with a myocardial flow reserve 1.75. Coronary computed tomography angiography (CCTA) showed an obtuse marginal defect. Fused PET and CCTA showed a downstream perfusion defect. Invasive coronary angiography showed marked luminal obstruction with a fractional flow reserve (FFR) of 0.34.
Conclusion
Intensivists need to be proactive: find out what technology is available in their institution, identify which patients could have treatment enhanced, and be prepared to move beyond traditional imaging practices. Diagnostic and interventional procedures in radiology are used regularly in everyday critical care practice. Functional imaging is possible in multiple imaging modalities, some for clinical use, but many still at the research stage. Functional brain and cardiac imaging is the next frontier in the ICU. As logistical considerations are still a challenge, bedside imaging techniques should be a major objective.
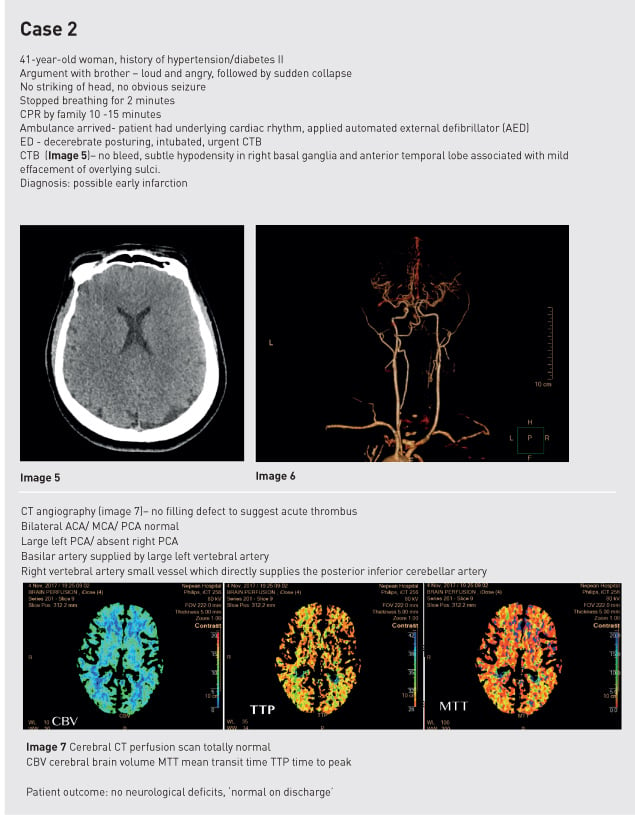
Case studies
Conflict of interest
Anthony McLean declares that he has no conflict of interest.
Abbreviations
ACA anterior cerebral artery
CBV cerebral blood volume
CT computed tomography
CTB computed tomography brain
ECV extracellular volume
ICA internal carotid artery
ICU intensive care unit
MCA middle cerebral artery
MTT mean transit time
PCA posterior cerebral artery
PET positron emission tomography
References:
Driessen RS, Raijmakers PG, Stuijfzand WJ et al. (2017) Myocardial perfusion imaging with PET. Int J Cardiovasc Imaging, 33(7):1021-1031.
Haaf P, Garg P, Messroghli DR et al. (2016) Cardiac T1 mapping and extracellular volume (ECV) in clinical practice: a comprehensive review. J Cardiovasc Magn Reson, 18(1):89.
Haghbayan H, Boutin A, Laflamme M et al. (2017) The prognostic value of MRI in moderate and severe traumatic brain injury: a systematic review and meta-analysis. Crit Care Med, 45(12):e1280-e1288.
Laine GA, Allen SJ (1991) Left ventricular myocardial edema. Lymph flow, interstitial fibrosis, and cardiac function. Circ Res, 68(6):1713-21.
Lui YW, Tang ER, Allmendinger AM et al. (2010) Evaluation of CT perfusion in the setting of cerebral ischemia: patterns and pitfalls. AJNR Am J Neuroradiol, 31(9):1552-63.
Puntmann VO, Peker E, Chandrashekhar Y et al. (2016) T1 mapping in characterizing myocardial disease: a comprehensive review. Circ Res, 119(2):277-99.
Taylor AJ, Salerno M, Dharmakumar R et al. (2016) T1 mapping: basic techniques and clinical applications. JACC Cardiovasc Imaging, 9(1):67-81.
Ugurbil K (2016) What is feasible with imaging human brain function and connectivity using functional magnetic resonance imaging. Philos Trans R Soc Lond B Biol Sci, 371(1705). pii: 20150361.
Verbrugge FH, Bertrand PB, Willems E et al. (2017) Global myocardial oedema in advanced decompensated heart failure. Eur Heart J Cardiovasc Imaging, 18(7):787-794.
Villien M, Wey HY, Mandeville JB et al. (2014) Dynamic functional imaging of brain glucose utilization using fPET-FDG. Neuroimage, 100:192-9.