The profitability and success of an imaging center depend on day-to-day management decisions. Who provides the facts for these decisions? Where is potential for improvement in the workflows? How high is the workload? How can it be ensured that risk factors are identified promptly and that targeted measures are derived?
Radiology IT systems such as radiology information systems (RIS) or referrer and patient web portals contain a multitude of valid data from their workflows. But only with intelligent software solutions can this data be processed to quickly identify problems, detect trends and generate reports. This provides a stable basis from which fact-based decisions can be derived.
The requirements for such an evaluation tool vary greatly from institution to institution. Is there a separate controlling department? Are external consultants involved? Do the internal structures require a selective rights system?
Adding Value Based on Workflow Data
Extensive statistics enable effective quality management and controlling. Modern radiology information systems offer their users ready-made standard statistics for this purpose; in medavis RIS, for example, there are 450 predefined statistics included. For more individual requirements, these standard evaluations can be adapted or supplemented to suit individual needs. The workflow concept must also be taken into account here: it is particularly efficient to define the required analysis once and then send the reports automatically to a defined group of recipients at regular intervals, for example on a weekly basis. Another option for even more individual evaluations is analysis of data taken directly from the database, which can then be processed in existing statistical tools.
Management Information in Real-Time
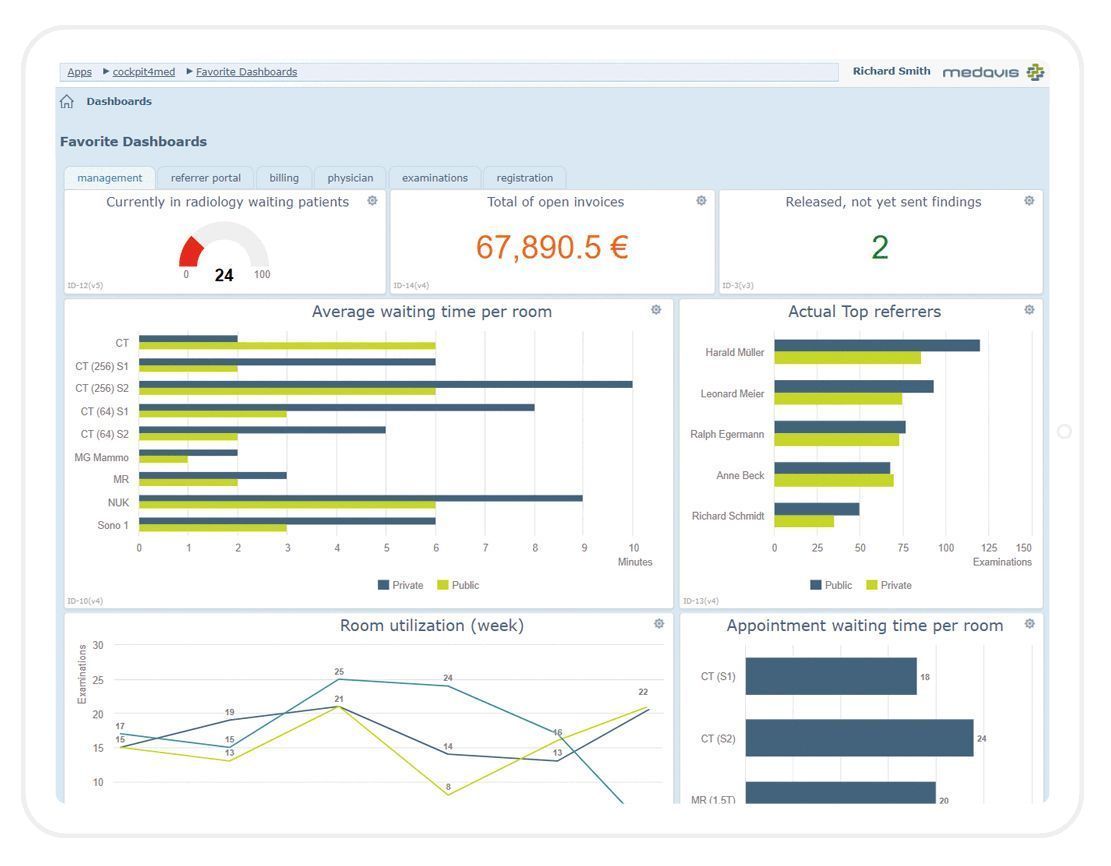
A web-based radiology dashboard such as medavis cockpit4med goes one step further: it extracts data from various sources such as the radiology information system, referral and patient portal, even across multiple sites, and processes it into valid information - in real time. Data is clearly displayed on any device. This means that the current work situation can be viewed at any time without first having to prepare data, and radiology can be managed economically and quality-oriented based on facts.
Some examples from the radiology workflow:
· Registration: How long is the current patient waiting time and how many patients are waiting per modality?
· Examination: What is the average workload per week or per day?
· Reporting: How many reporting orders are waiting to be processed? How many are waiting for release?
· Billing: What is the total amount of open invoices?
· Management: What is the current room utilisation?
· IT: Is the HL7 queue currently full?
· Referrer Communication: How many reports are digitally transmitted via web portal?